

Intro
Grafana is one of the industry leaders in real-time data analytics and visualization. In this blog, I will instruct in the ways of creating a Grafana instance on an EC2 instance. The Grafana instance will be on Amazon Linux 2023 which uses yum. If you’re lazy and you don’t want to do any of these: go to grafana.com and sign up for an account, it’s practically the same thing.
However, sometimes a custom, separate instance may be required for some reason. In this case, you can make one pretty easily on an EC2 instance (if you don’t want to use AWS Managed Instance for Grafana, I know, there are a lot of caveats).
Step 1: EC2 Instance with Security Group
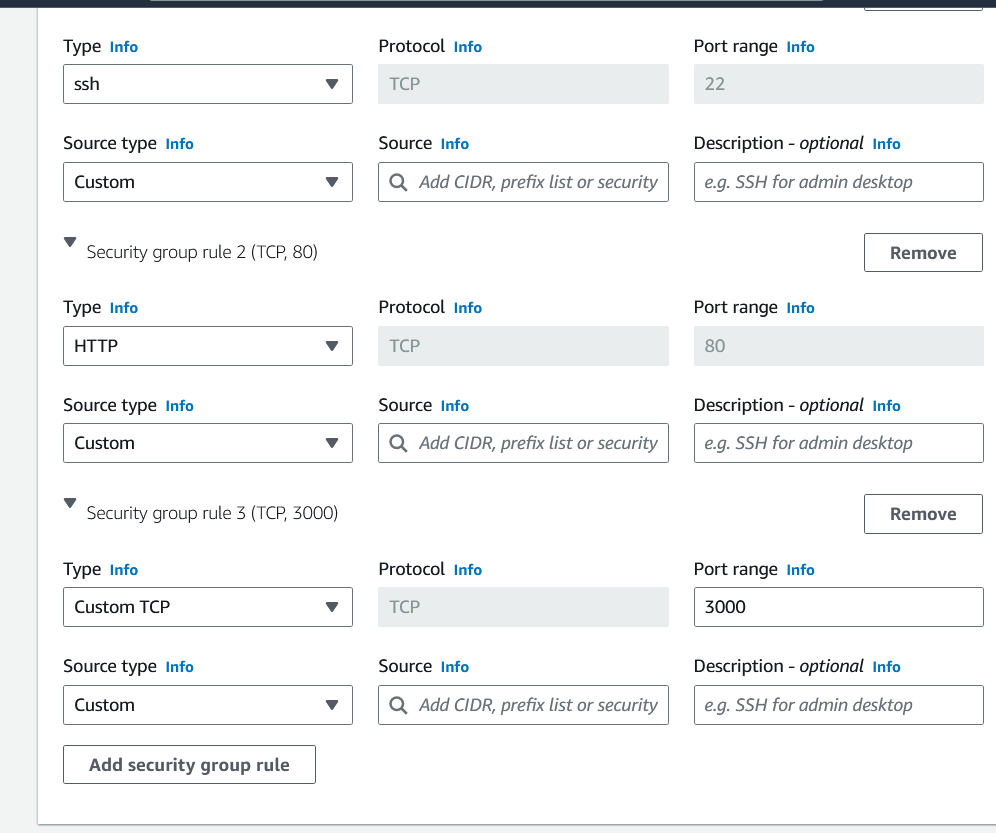
Launch an EC2 instance. Most of the specs are irrelevant. However, you may want a slightly larger instance. You will also need a .pem file for SSH into the system that you will need to have downloaded. In the security group, create a group or choose an existing group which has configurations open for ports 22(SSH), 80(HTTP) and 3000(Grafana). It should be similar to this:
Once this is done, we can connect to the instance using SSH:
Step 2: Connect to the instance and install Grafana
You can SSH into an EC2 instance easily enough, using the .pem file, it is a fairly easy connection with a command in this format:
ssh -i "<file>.pem" <user>@<EC2_instance_name>.compute.amazonaws.comThen, use this command to install Grafana (I’m using the OSS edition, version 10.0.1, you can pick out your edition here).:
sudo yum install -y https://dl.grafana.com/oss/release/grafana-10.0.1-1.x86_64.rpmStep 3: Activate the Grafana Server
First, reload the system daemon after installation:
sudo systemctl daemon-reloadStart the Grafana server:
sudo systemctl start grafana-serverCheck the status of your Grafana server to check if it is running:
sudo systemctl status grafana-server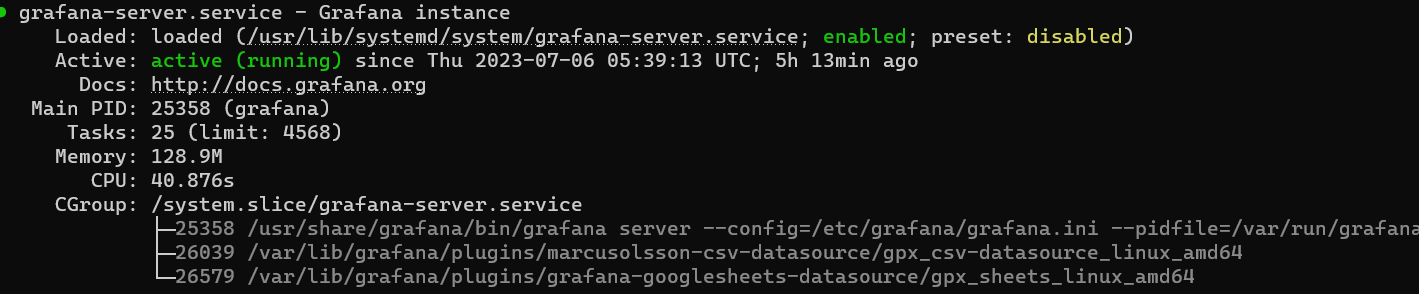
If it’s running, you’re good.
Then, enable the Grafana service, which creates a symlink and exposes the port:
sudo systemctl enable grafana-server.serviceYou can now access your Grafana instance on <your-public-ip-address>:3000. The public IP is usually automatically assigned to the EC2 instance. Your end result in the webpage will look like this:
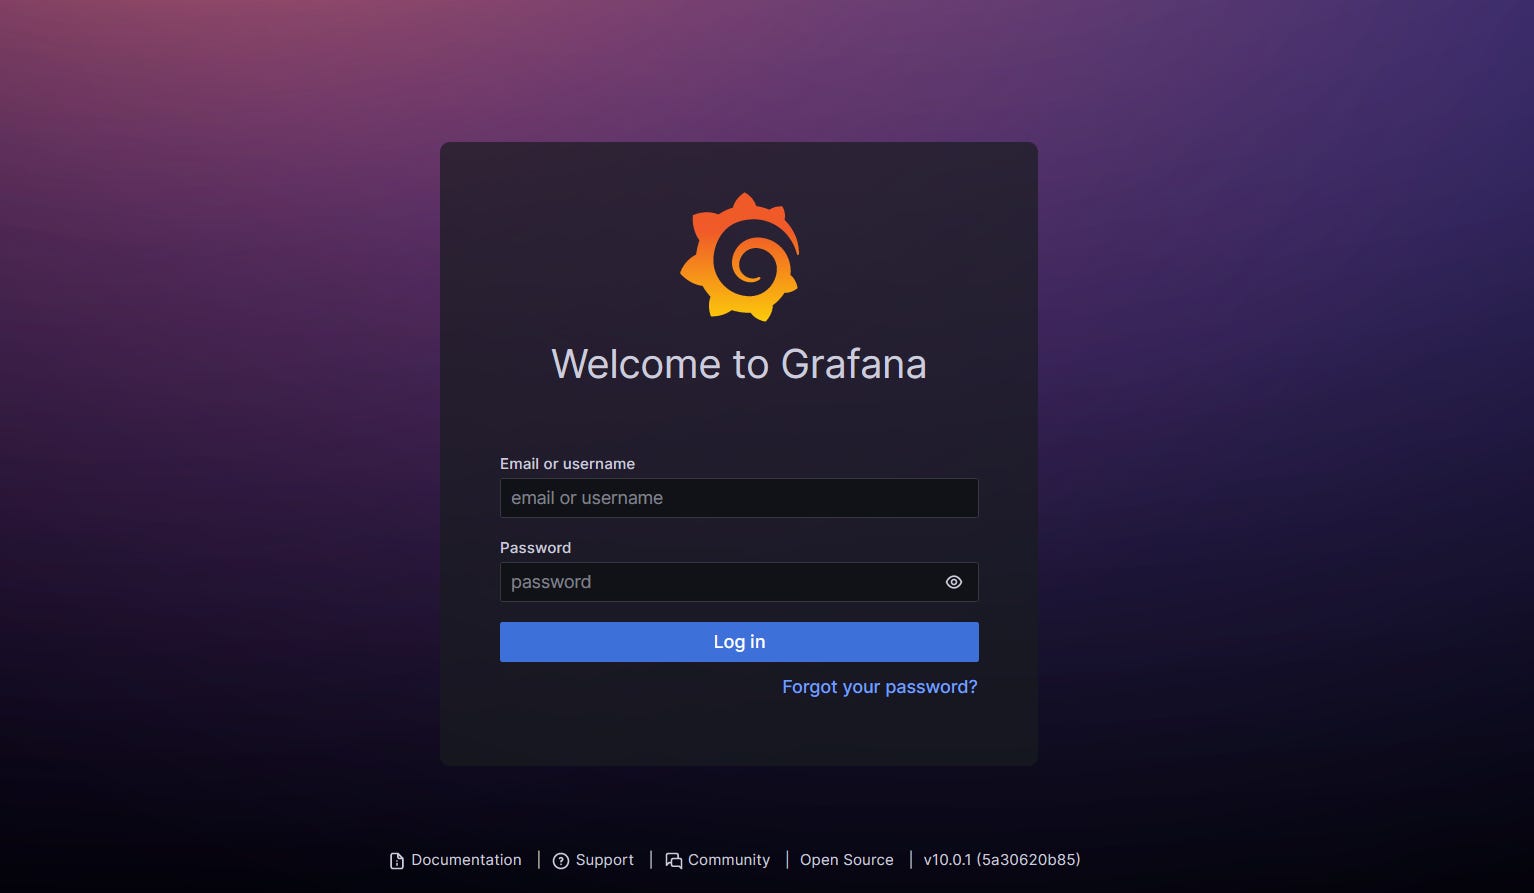
The initial username and password are both admin, you can change them later.
What’s next?
A lot. The scope of Grafana’s available data collection is enormous. Somewhat incomprehensible. Any way that you can collect data, you can likely get that data into Graphana. You can collect from multiple data sources and visualize and analyze them with a wide array of tools. So check it out, it’s a whole new world to explore.