

Alright, in my previous post I gave you a nice rundown, a flittering glance if you will, on BigQuery and all of the big things that it can do. But that was just a glance, a drop in the bucket. This article will also just be a drop, but two drops is double the knowledge, so, good for you.
I’m going to do a three article mini-series within this article series to describe the methods of interaction with BigQuery. Namely, the three primary ways one performs actions on BigQuery: UI (User Interface), CLI (Command Line Interface) and SDKs (Software Development Kits). We’ll start with the UI in this article.
The User Interface for any cloud is probably the part of the cloud that has the least thought put into it (barring some exceptions). They’re all meant to be bare bones, simple, to the point, some might even say ugly. That is because most of the work in the cloud is done under the surface, through API calls to servers and such. But that doesn’t mean that the UI is useless, nor does it mean that it should be ignored. Especially in a data service like BigQuery, where the visualization of data can play such a significant role.
The BigQuery console
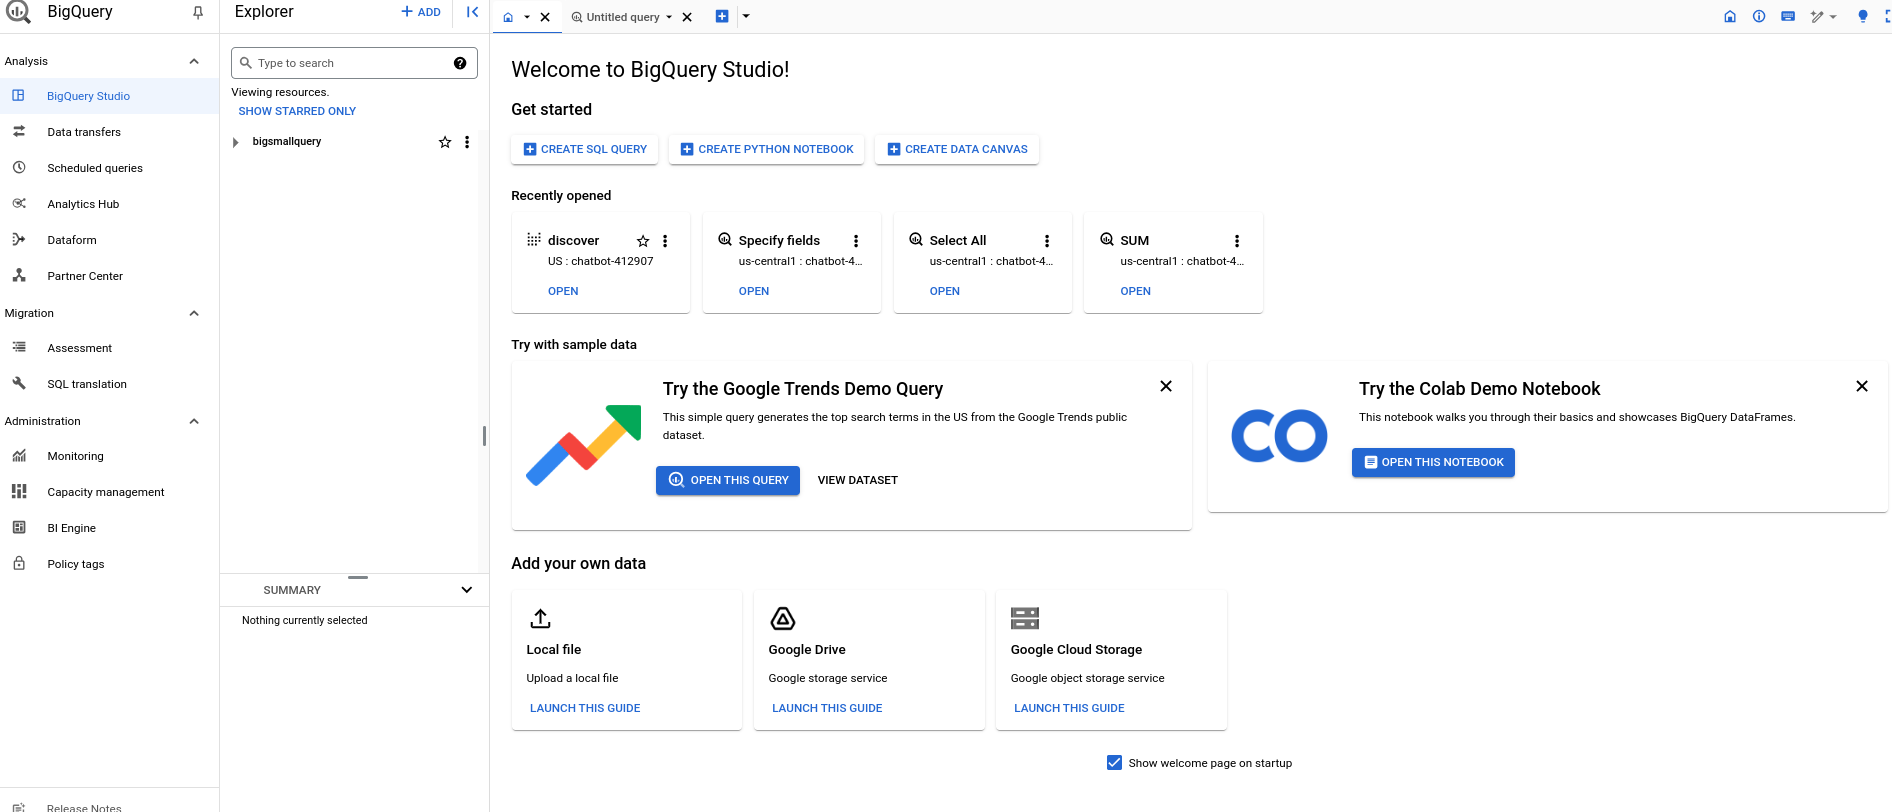
The console is meant to replicate similar UI consoles that you would have in a database software like SQL Workbench. It brings familiarity with people who have used such consoles in the past. Let’s start with the most basic operation, which would be creating a dataset ( a task that is probably the easiest in this interface).
Creating a dataset
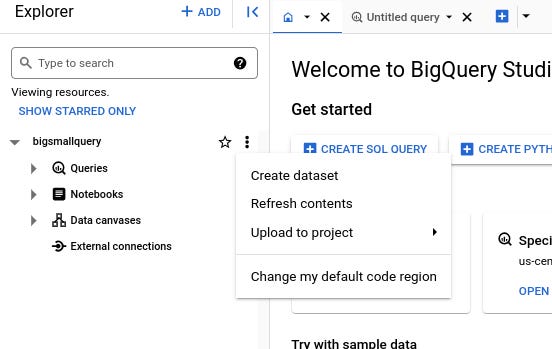
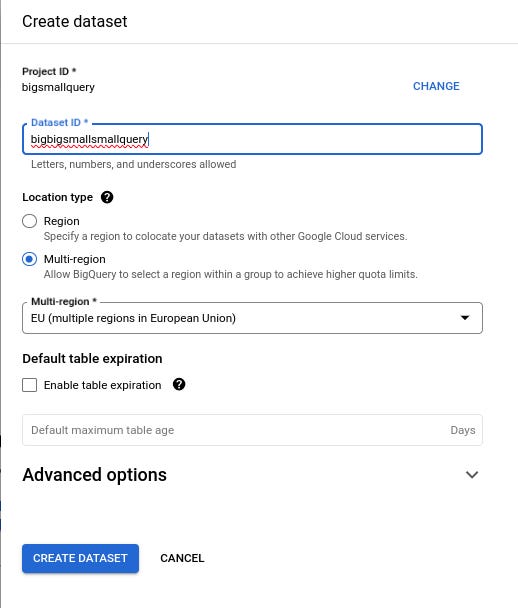
Hit those three dots and click the button to create the dataset. Give it a recognizable name and create your empty dataset.
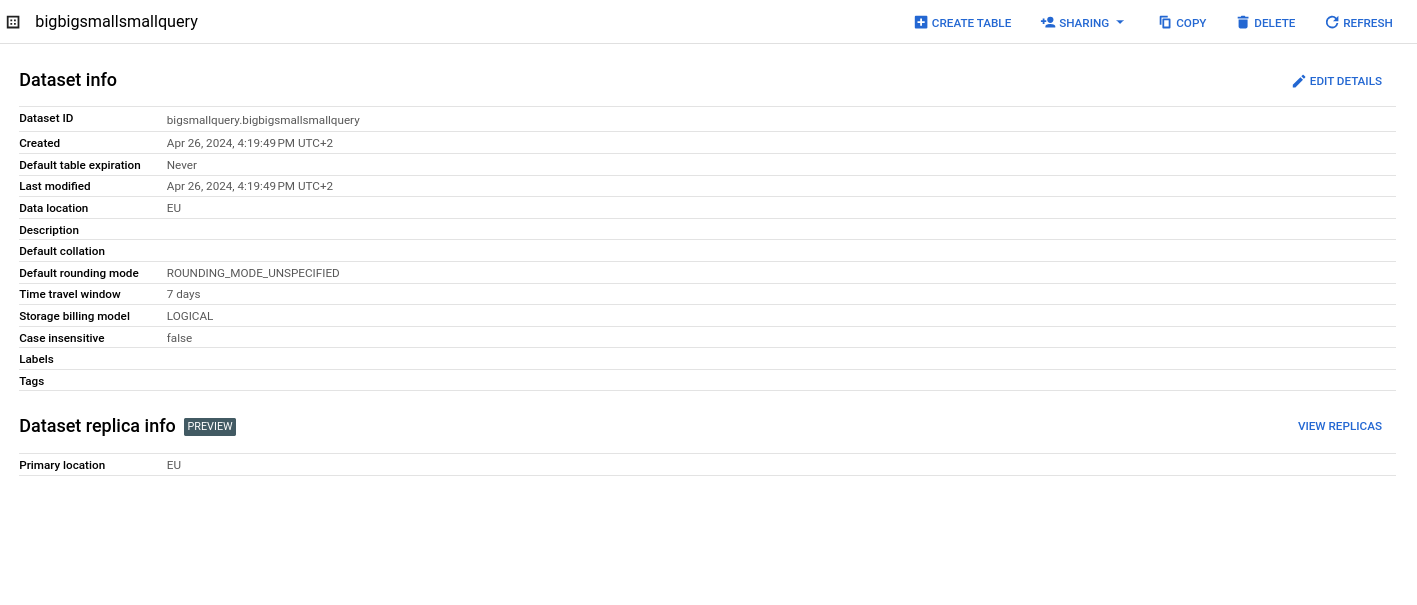
You will then see the details of the dataset along with permissions, the option to create a table, and the option to copy and delete the dataset if needed. It’s overwhelming, I know. That’s why this blog series is going to be massive.
Let us now create a table. There are literally a thousand different iterations on how you can do it. I will do it with a fairly simple use case: the CSV import. It is a favorite of data scientists.
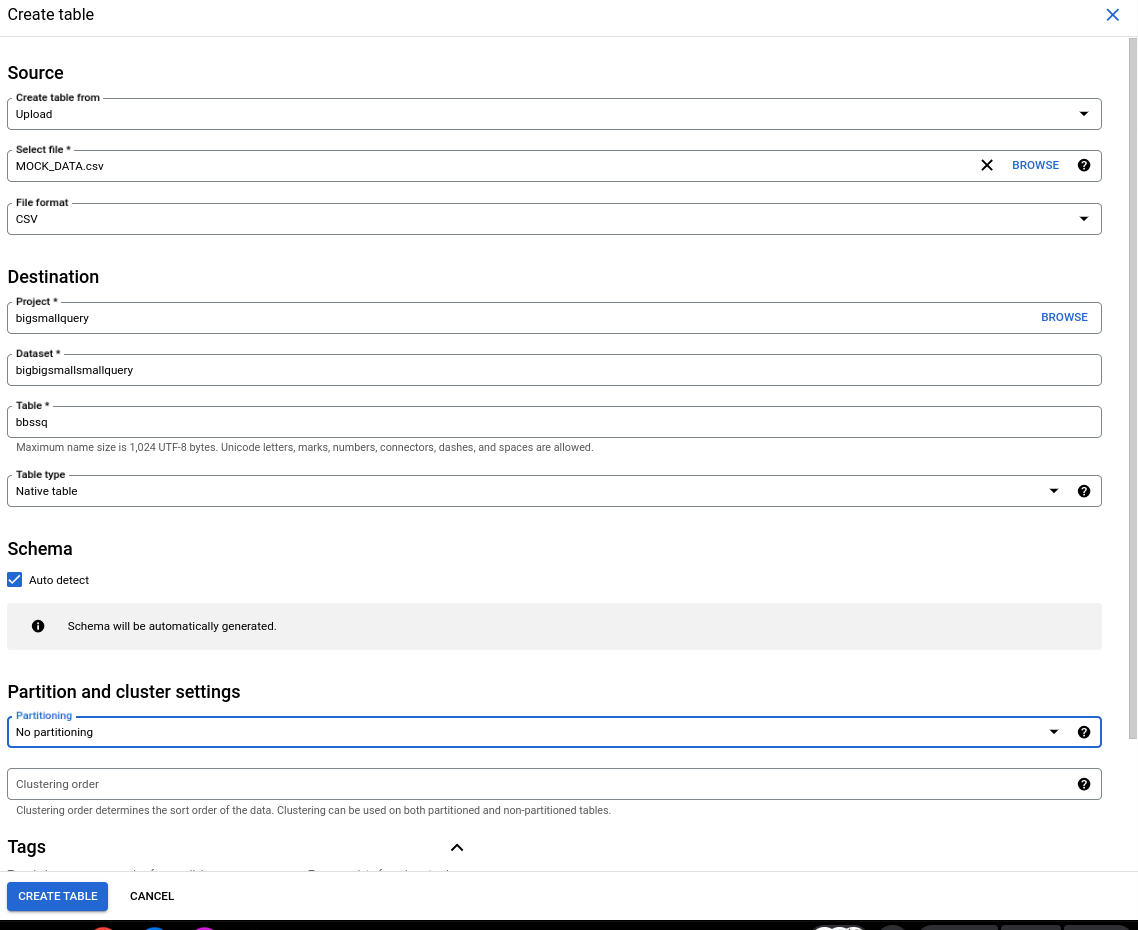
And there is another massive block of information. I’ve simplified it and used a mock CSV that I had along with an auto-detect for schemas (useful if you’re not a control freak). We then get the details of the table, I’ve put it on the preview tab to show how it displays the data:
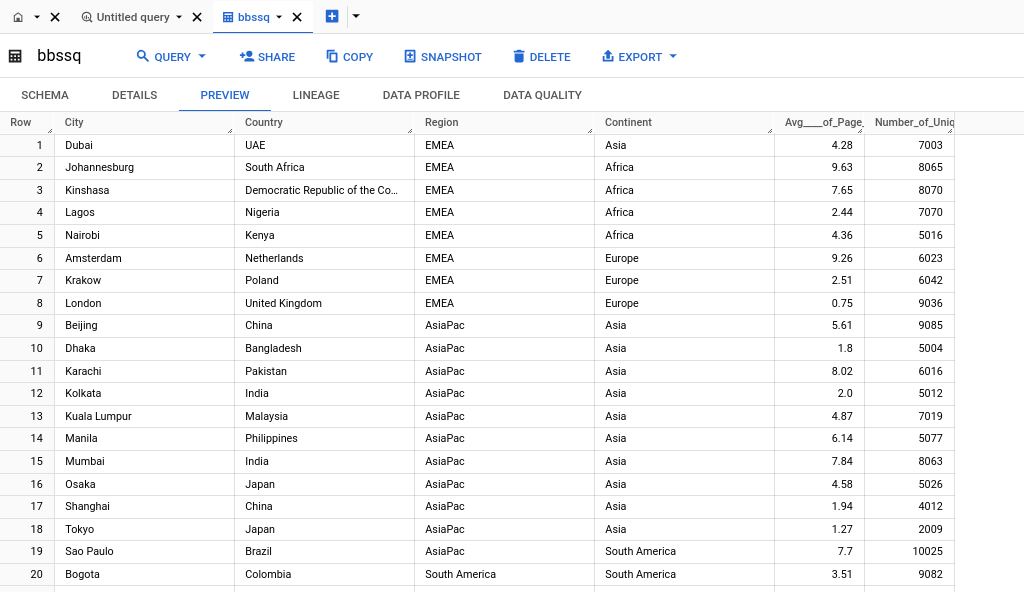
And … that’s it. That’s it for creating a simple table for now. But when we get back to the UI, there will be more. But for now, this is the first step. This is a little abrupt, but, again, think of this as just a drop in the ocean.