

Looker Studio is a member of Google Cloud’s Looker family. It is the smallest of the children, but that doesn’t mean it is without its uses. It connects to a large number of data sources and can pull data from all of them. It can even update live data. However, the tool is only half the equation when it comes to performing data operations. The other half comes from the data itself (more specifically, the nature of the data).
In many cases, a live updating data source is unnecessary, with a snapshot of the data in a certain state being preferred. For example, if you wanted a chart that had all of the sales data upto the 8th of July, but you still needed to update the sheet for subsequent sales, you’d need to make a separate data operations location for the data upto the 8th. This is where a little data connector called Extract Data comes in handy.
For today’s demonstration we will use this public sheet which contains all of the data from the 2023-24 NFL season (I really like NFL football, go Texans). We will import and refine the dataset and then create a Extract Data from it.
Extact Sheet Data
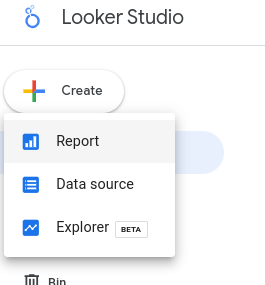
Go to lookerstudio.google.com and create a new Data source.
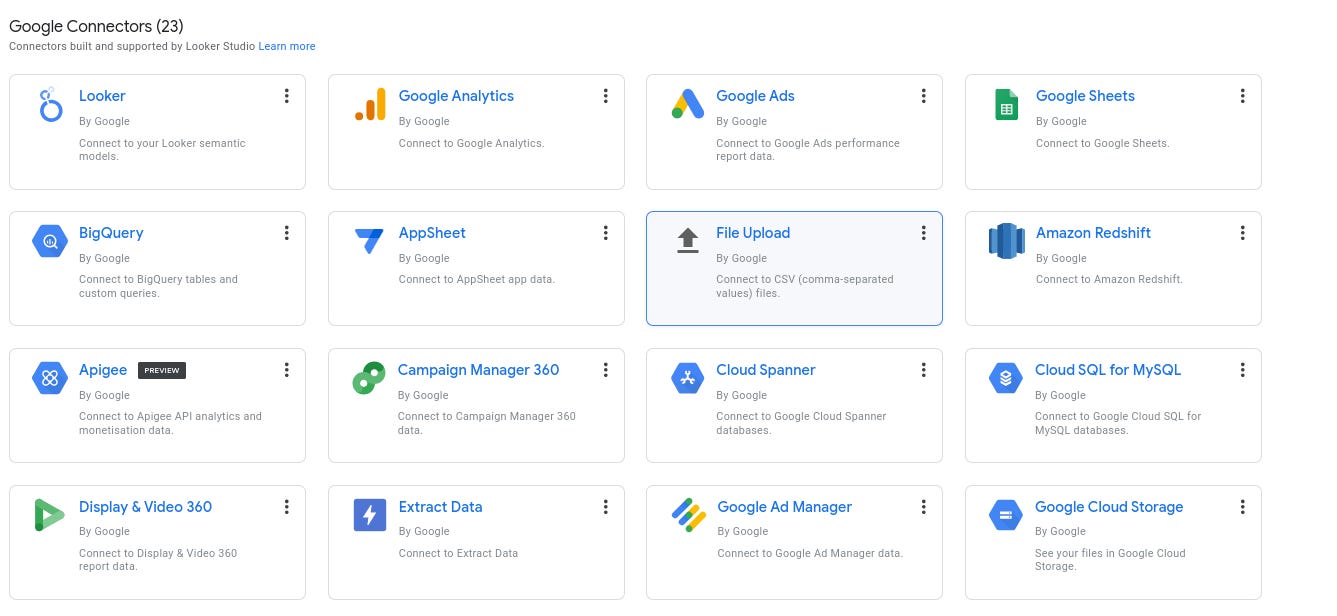
You will be presented with a number of data source options. The two relevant ones for this are Google Sheets and Extract Data.
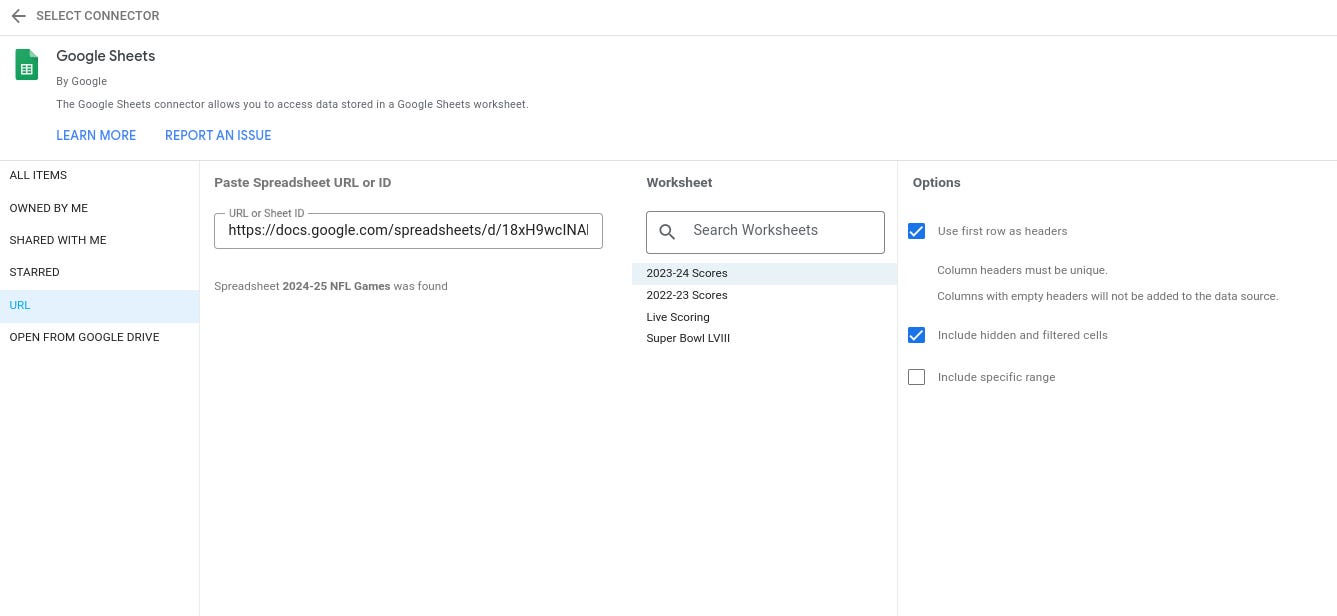
Click on Google Sheets first and in the URL for the Select Connector option add the URL of the Google Sheet from before. You’ll get something like this:
Change nothing else here. On the top right, you’ll see a Connect button, click on it to connect to and read this public sheet’s data. You’ll see data like this:
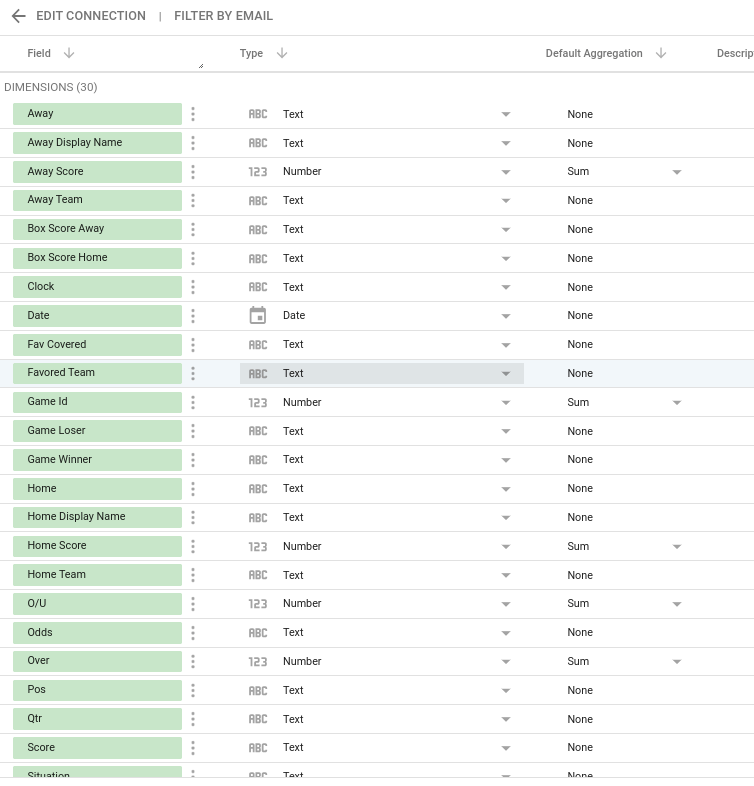
We have 30 dimensions and most of them will be irrelevant to our diagram in Looker Studio, so we’ll remove them in Extract Data. For now, lets keep everything. In Looker Studio, we’ll find a data source with the name of the sheet that we took the data from.

Use Extract Data
Now, lets create a data source again, this time choosing Extract Data. Your data source will be in a list of selectable data sources. Select it.
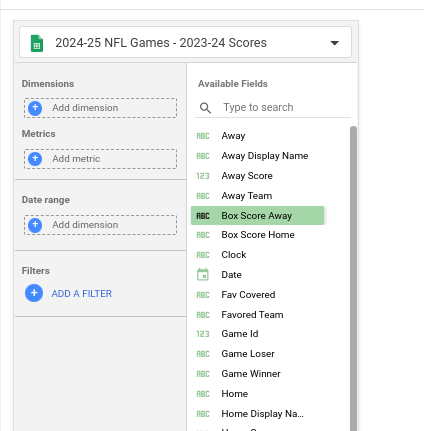
For simplicity, add Game Winner, Game Loser, Home Team and Away Team as the Dimensions to be extracted, that is all we’ll use. Click Save and Extract on the right. Then, click Create Report on the top right of your screen.
This will create Looker Studio view with a pre-populated table like so:
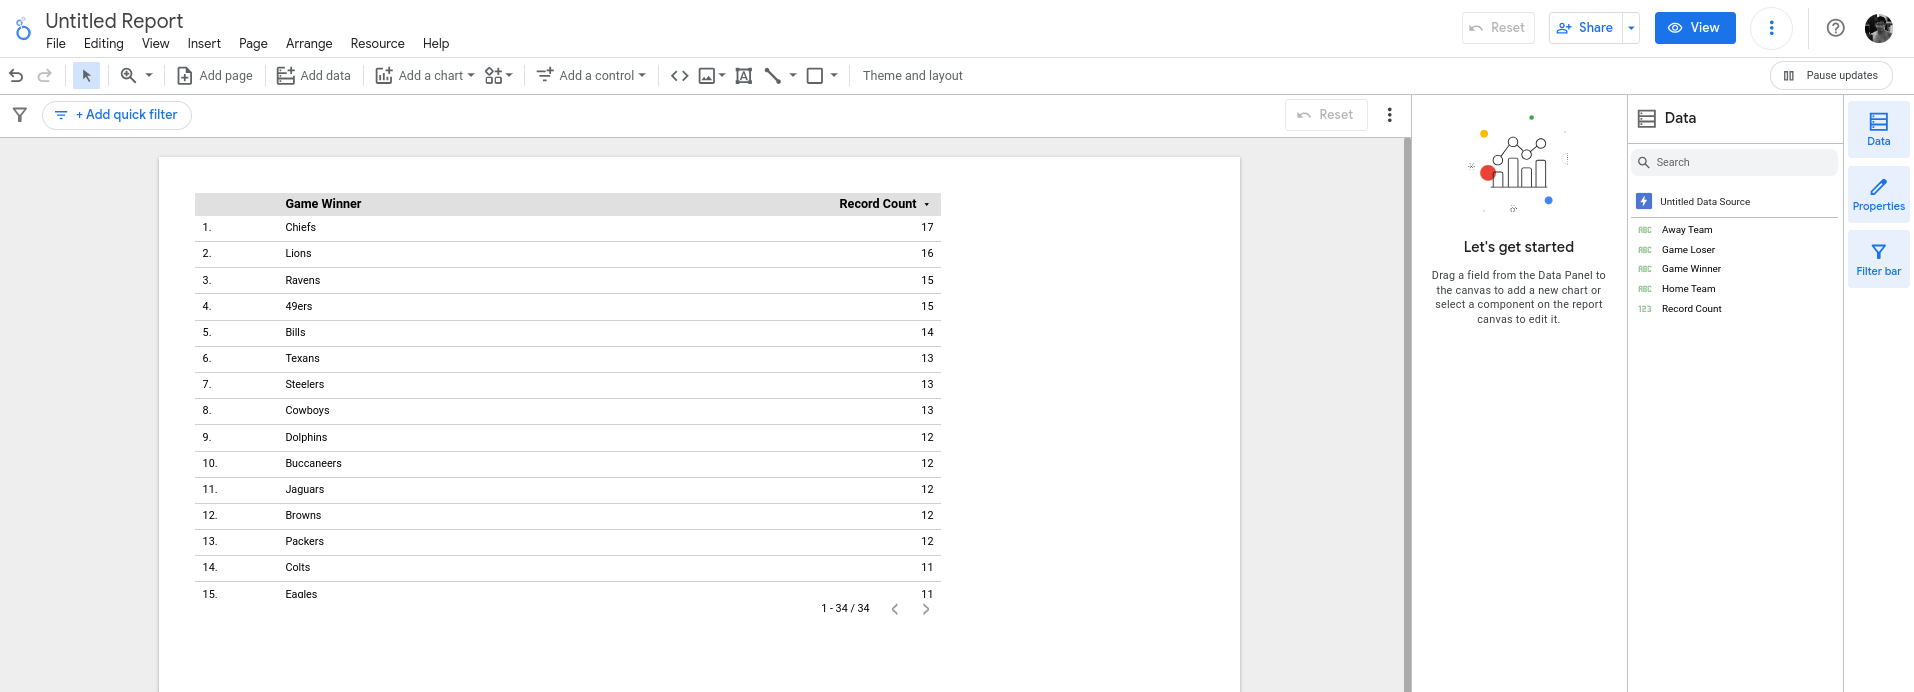
Very clear, concise, and useful. This is great for data that needs to remain static, or data that you know will not be updated. This is, of course, the simplest of methods and functions, but you can get as complex with it as your imagination allows. You can use Extract Data on other data sources as well as long as they can be extracted to Looker Studio.